Solar farm monitoring with drones and AI
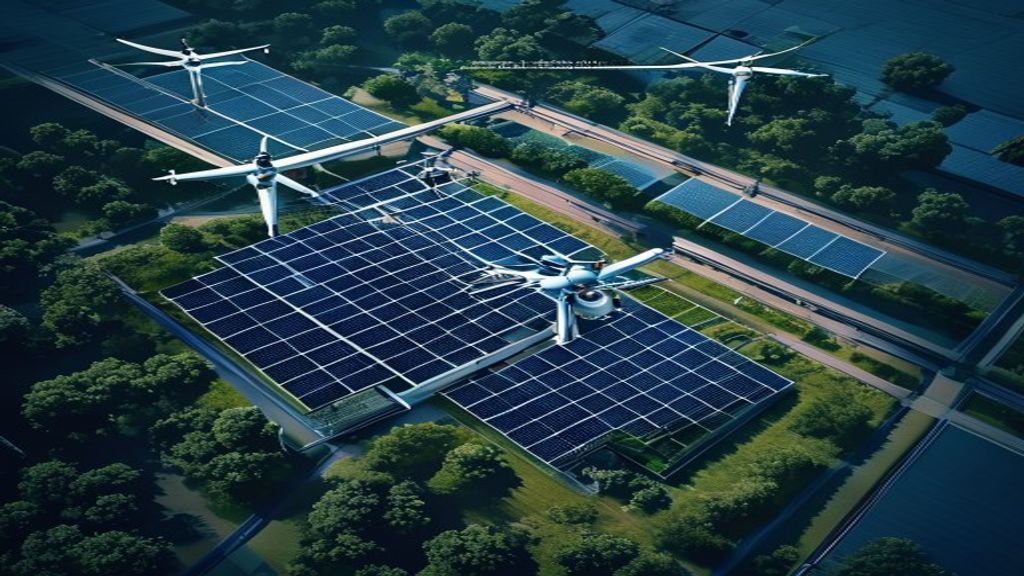
Solar farm monitoring should not depend only on supervisory alarms or corrective site visits. In large plants, drones with thermography and AI create a visual and georeferenced diagnostic layer, especially for distributed issues across modules, strings and tables.
The value appears when the flight stops being an isolated deliverable and becomes part of the O&M routine. With each campaign, the plant gains a history of anomalies, recurrences, critical sectors and evidence for maintenance planning with less guesswork.
Where drones fit into monitoring
Drones efficiently capture thermal and RGB images over large areas in a short time. In solar farm monitoring, they complement electrical data from inverters, meters and SCADA with visual field evidence.
This is especially useful when loss does not appear as a single failure. Soiling, vegetation, partial shading, heated cells, broken modules and string issues can spread across the plant. Drone inspection finds those signals and helps the field team locate them.
From flight to O&M report
The ideal workflow starts before takeoff. The team defines areas, altitude, time of day, minimum irradiance conditions and capture standards. After the flight, images need to be organized by location, classified by anomaly type and transformed into a priority list.
- Plan the flight according to plant layout and O&M objectives.
- Capture thermography and RGB with repeatable standards.
- Associate events with table, module, string or inverter.
- Classify anomalies by type, severity and confidence.
- Generate a report with intervention ranking and evidence.
- Compare campaigns to find recurrences and critical sectors.
How AI improves scale
In a plant with thousands of modules, manual triage consumes time and increases variation between analysts. AI helps detect patterns, group events and suggest initial classifications. The technical team remains essential, but can focus on validation and decisions.
This model also improves consistency in the solar thermography report. Instead of loose images, the manager receives ordered anomalies, visual examples and practical recommendations: verify a string, clean a sector, trim vegetation, monitor recurrence or open a work order.
Monthly routine example
A plant can run monthly flights in critical areas and full campaigns in quarterly or semiannual windows. If monitoring shows an increase in hotspots in one region, maintenance acts before losses accumulate. If the pattern is linked to soiling, cleaning can be sectional instead of generalized.
Over time, the history shows whether actions solved the issue. That feedback is what separates a one-off inspection from a photovoltaic monitoring system.
Indicators to track
- Number of anomalies per installed MW.
- Distribution by type: hotspot, soiling, shade, physical damage or string issue.
- Time between detection and correction.
- Recurrence by module, table, string or inverter.
- Sectors with the highest concentration of events.
- Severity evolution between campaigns.
ZenVision connects drone, thermography, AI and reporting so solar farm monitoring becomes more than a visual check. The goal is to give O&M a clear view of what affects performance, where to act first and how to prove that the action worked.