
Back to the Knowledge Hub
ZenVision · Technical documentation
ZenVision Datasheet
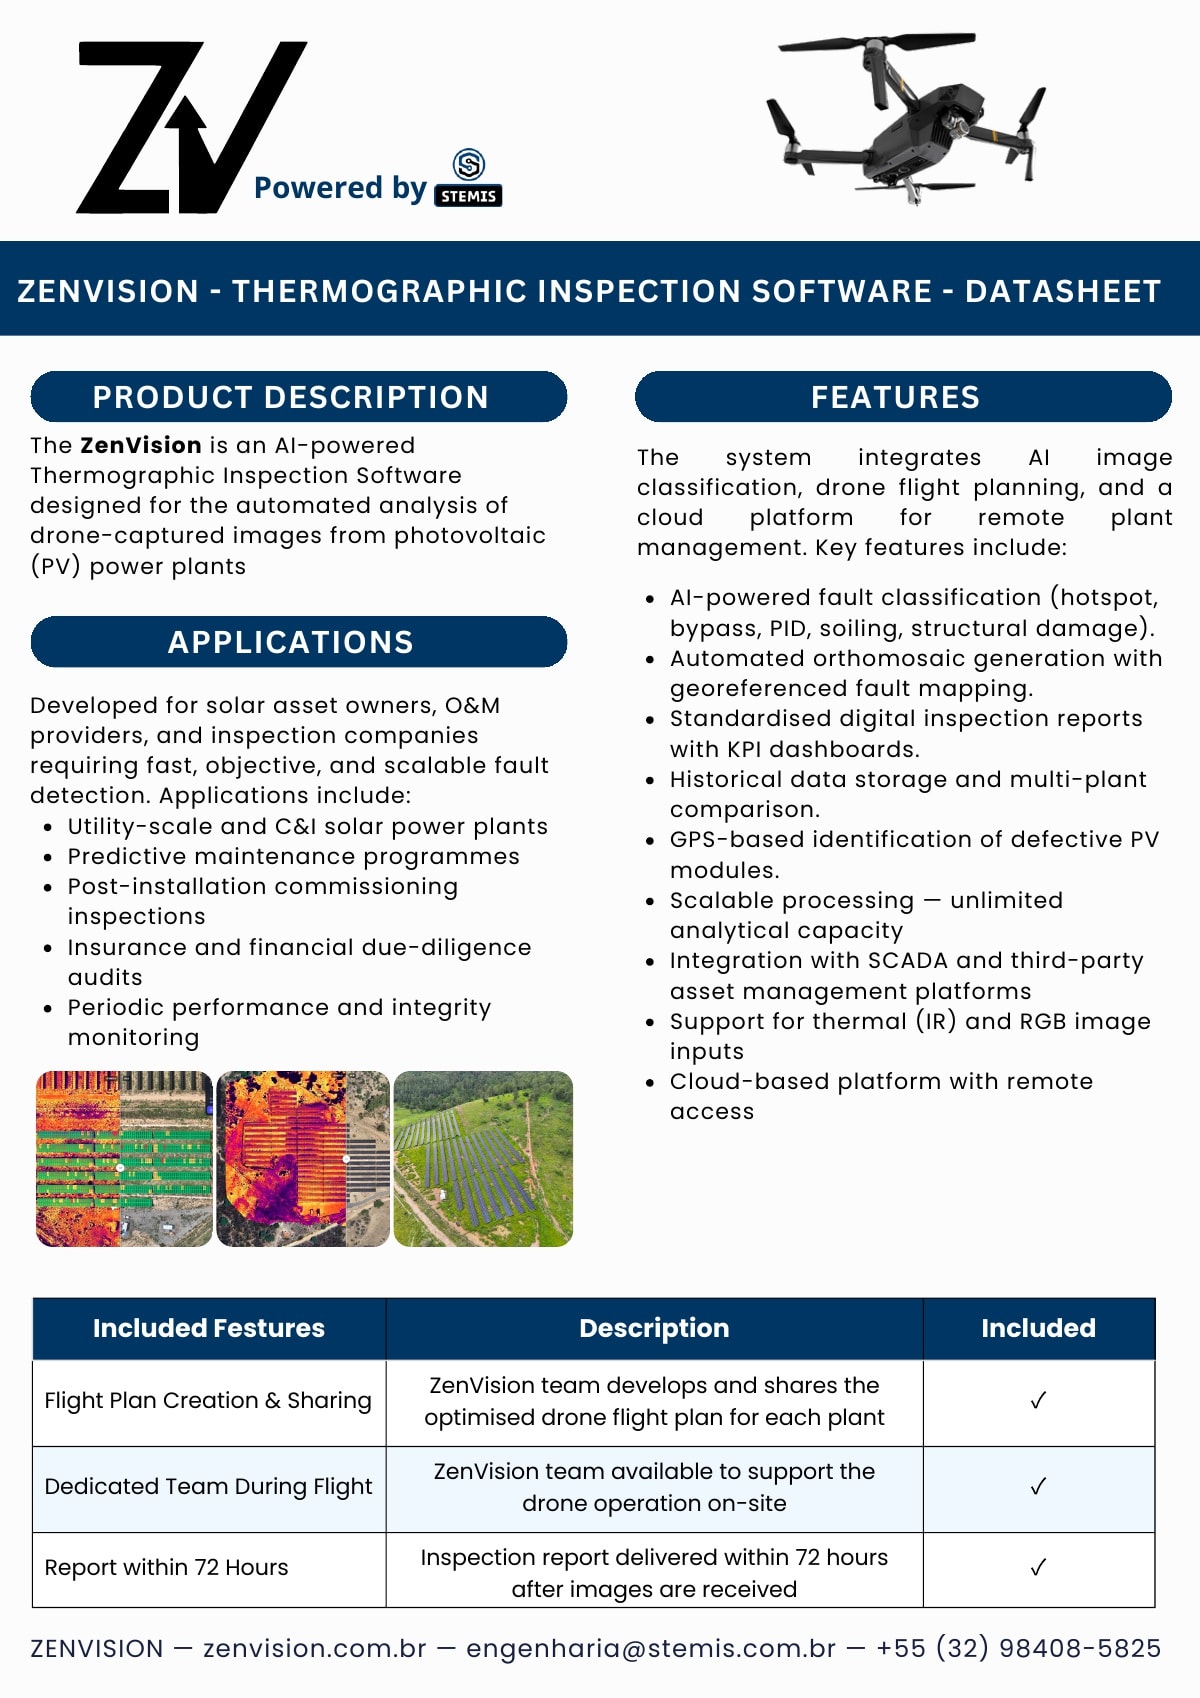
Turn thermal and RGB drone images into georeferenced fault maps and a standardized report delivered within 72 hours of image receipt.
About this resource
ZenVision
The datasheet follows the complete workflow from optimized drone flight planning to cloud AI analysis, orthomosaic generation, KPI dashboards, and the final report. It lists classifications such as hotspot, bypass, PID, soiling, and structural damage, plus unlimited analytical capacity, multi-plant history, and SCADA/API integration.
PDF3 pages2.3 MB
Access the complete resource
Enter your details to unlock the download immediately.